To make a Point-and-Figure diagram and use technical analysis to take advantage of chart trading, you can follow these steps:
- Select a reliable charting software that provides Point-and-Figure charting tools.
- Choose the security you want to analyze and set the time frame.
- Determine the box size and reversal amount. Box size is the minimum price movement required to draw a new X or O on the chart, while the reversal amount is the number of boxes required to change the direction of the trend.
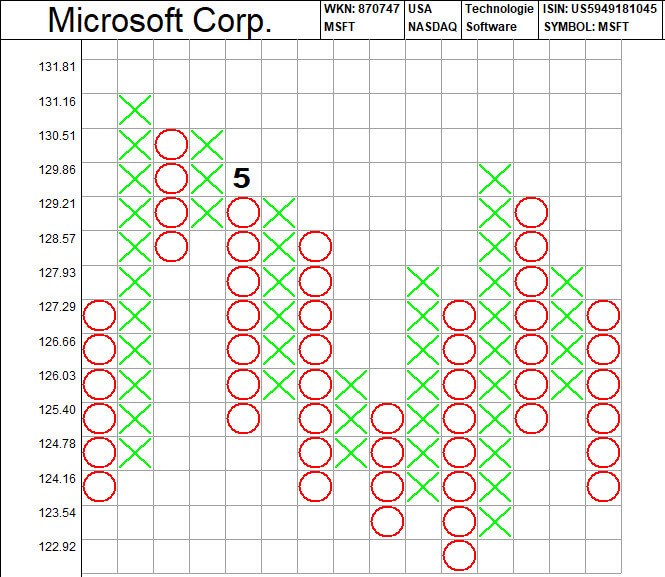
- Plot the X's and O's on the chart based on the price movements. X's represent an uptrend, and O's represent a downtrend.
- Look for patterns on the chart, such as double tops or bottoms, trendlines, and support and resistance levels.
- Use technical analysis indicators, such as moving averages or relative strength index (RSI), to confirm the trend direction and identify potential entry and exit points.
- Determine your trading strategy based on the analysis, and set your stop-loss and take-profit levels accordingly.
👉 It's important to remember that Point-and-Figure charts are just one tool among many in technical analysis, and that no single tool or chart can guarantee success in trading. It's also important to practice and refine your analysis skills through continuous learning and experience.
💥At this point, we should have started learning how to create a point and figure diagram on a chart. The equipment required to create a diagram is a graph book, which has a square grid that was used during childhood to graph. Although some people may say that computers and diagramming programs such as Points and Figures are available, why bother learning it? Is it obsolete? In our opinion, understanding the basic principles would not cause any harm. First, gain knowledge and expertise, and then use a computer to help create a diagram. However, for those who are more proficient and believe that computer-generated diagrams can sometimes be challenging to read because the image is too small, there may be a way to solve this problem.
💥The first step in creating a diagram is setting the size of the box (box size) such that each box is equal to the amount of price change or spread in stock trading. For instance, if the stock price fluctuates between 5 and 80 euros, the box size will be 5 euros, which is equal to the change in stock price when trading.
💥However, in practice, the box size is set at the trader's discretion. To analyze data effectively, it can be used as a guide. It should be noted that the box size affects the sensitivity of the change in price direction. If the value is less, the change in direction will be faster. Therefore, the size of the box should be related to the range used in the chart for trading. For instance, if one wants to study long-term price movements, the box size should be larger than usual.
💥The second step is to understand how to enter prices into the table and the rules that must be followed to create a diagram. This requires knowledge of the rules along the way. Consider the following example:
💥Suppose the stock price is currently 15 euros. We record the value of 15 euros using the X or O symbols, not as a numerical value. If the price moves up, the X symbol is used, and if it moves down, the O symbol is used. For instance, if the price moves up to the highest price level of 40 euros and closes at that level, we will have 6 X symbols because each box used to record the X value has a box size of 5 euros. When the maximum price changes to 30 euros, six X's are added.
💥On the other hand, if the stock price falls from the price level of 35 euros to the lowest price of 10 euros and closes at that level, the O symbol will be used to record the value.
💥Once we understand which symbols are used in which cases, we can explain the case when the stock starts with the X row first, assuming that the price is still rising the next day with a maximum price of 65 euros. In this case, we need to record prices up to the price level of 65 euros. However, if the highest price on the third day does not exceed the highest price (65), we need to consider whether the Day 3 Low is below the High (65) for at least three price movements. If the minimum price of 55 euros is not less than three periods of price change, worth 10 euros, we don't record anything. On the other hand, if the lowest price on the third day is 15 euros, which is below 65 euros and down more than 15 euros, we start recording the O symbol in the column to the right of the X column starting.
💥You may be wondering why 15 euros is used as a criterion and how the X symbol is changed to an O. Well, it's actually a popular rule called Three-box reversal, which is derived from three times the box size. In this case, the box size is equal to 5 euros, so the Three-box reversal is equal to 15 euros. However, this rule can be changed to any value other than three times the box size, as long as it is looked at carefully. If the rule is changed, does the resulting diagram have any significance in terms of price movements? Can it provide a reliable buy or sell signal? If it works better, no one would forbid it!
💥Another thing to note is that in point and figure charting, the closing price is not taken into account. Only the highest and lowest prices are recorded. If on day 1, the column has an O instead of an X, it is because the price dropped from 60 euros to 45 euros. If the lowest price on day 2 is 15 euros, we continue to record the symbol O down to 15 euros. However, if the lowest price on day 3 is also 15 euros, which is not lower than the lowest price (15), we need to consider if the highest price is a Three-box reversal. If the highest price on the 3rd day is 20 euros (still lower than 15 euros), there's nothing to do. But if the highest price on the 3rd day is 70 euros, then the reversal starts. We record the symbol X in the column immediately to the right of column O and start in the address field higher than that of the symbol O (as shown in the example picture).
💥However, sometimes the price dynamics are quite wide. For example, the high on the 10th day may be higher than the high currently being recorded on day 9. But if we follow the rules and look at the lowest price on day 10, it may be worth more than a Three-box reversal. In this case, we continue to record the X symbol until the maximum achieved on the 10th day, regardless of the resulting minimum. However, doing so may ignore what could be a significant reversal signal. So we can either move the column to the right to save the O symbol or use the fish method to go down instead of using the O signal as a warning of a significant reversal during the day.