💥However, doing the analysis Knowing only the above pattern may not be enough Since sometimes we need to set point of buying and selling point, how do we know when to buy? While the trend is an uptrend, the answer that many people would say would be BUY ON SLOW. I would continue to ask: How much downward is acceptable in an uptrend? The main or method to solve such problems is Using trend lines, this will be your tool. Values for trend analysis From above we have separated the trend into 3 types, so there are 3 types of trend lines to be used as follows:

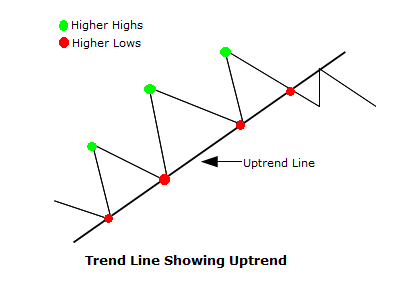
👉 1. Uptrend line The principle is not difficult at all. That is to say, the beginning We will draw a line from point 1 to point 3 (red dot) leaving the end of the line past point 3. This line is the uptrend line for the significance of this line. Or simply whether the leather is tough enough or not, it starts at the number 5 (red dot), which if the price can rebound at the number 5, that would indicate a significant uptrend line. If the price has adjusted down near this line again. It will use the predicted level on this line. Is the point used in Entering the spoon to receive shares again, such as number 7 (red dot)

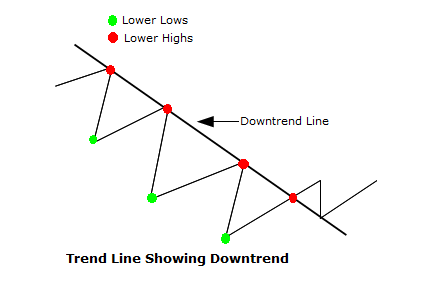
👉 2. Downtrend line The principle is reversed from the above in the sense that the line will use the old peak and the new peak as a point in the draw line, starting from point 1 to point 3 (red point) (if observed, it will find that the point 1 and 3 here are the vertices, as opposed to in the case of uptrends, which are the bottoms.) That's the difference in trend line formation. In terms of uptrend and downtrend, the measure of significance is looked at number 5. (red dot) If the stock price fails to cross the up downtrend line and has a downtrend following it, we call this downtrend line significant. This line again at point 7 (red dot) is the level where a sell-off is expected. If point 7 (red dot) still fails to break through the downtrend line, it will strengthen the downtrend line even more.

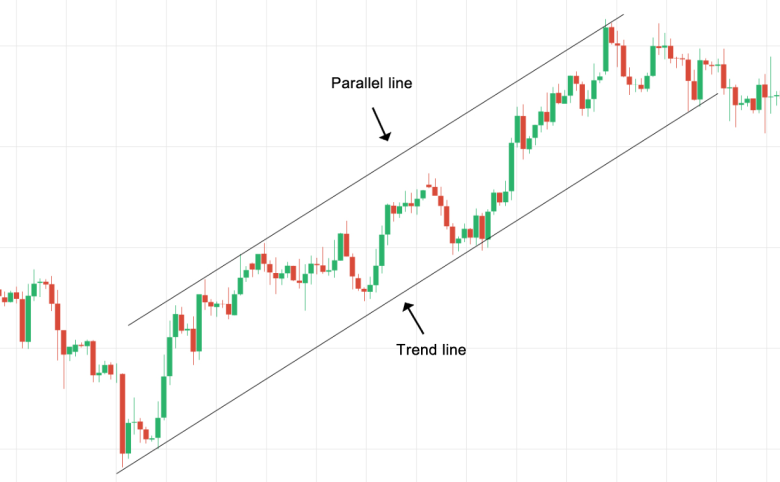
👉 Parallel line, In addition to the trend line mentioned above There are times when it is necessary to create a parallel line for the reason that there are cases when the price is clearly moving within the framework of the parallel line. Thus giving rise to a technical term came up another word is channel (hereinafter called flow pipe) I don't know if it will make the picture clearer or not? The principle of drawing parallel lines is not difficult at all. From the picture, use point 2 (green dot) as a starting point. Then draw a line parallel to the uptrend line, as shown in the figure, using point 2 (green dot) as the starting point parallel to the downtrend line, which will act as resistance in the uptrend form and will act as a resistance line. Support for downtrend images.

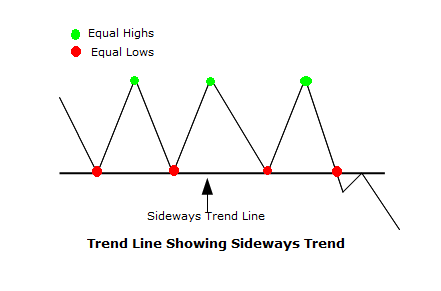
👉 3. Sideways is movement without direction. Is not markedly So the trend line in the case of sideways is relatively smooth, parallel to the ground (flat) and the channel in the case of sideways is like Pipes placed parallel to the floor, see from the picture because it can be seen that the flow of prices or index will be under the formation of a flow that lies horizontally which the price movement along the flow pipe sideways horizontally like this It is the origin of the name sideways.