💥S#.Data provides functionality that supports automatic downloading of historical market data from many data sources. But sometimes websites do not provide an API to make the process automatically. Fortunately, in addition to downloading you can import market data from CSV files directly.
💥TradingView is a charting platform and social network used by many traders and investors worldwide to spot opportunities across global markets. The major feature of the website - various historical dataset - that you can download as a csv file for further usage (e.g. - backtesting, analyzing).
💥For the TradingView website, you need a premium subscription to be able to export candles. Let’s look at this process step-by-step to understand how we can import this market data into S#.Data.

👉Visit
TradingView Website.
👉Select
Search Market for example NFLX.
👉Click
Launch Chart for view.


👉Select
Time Flame Candle for example 1 hr.
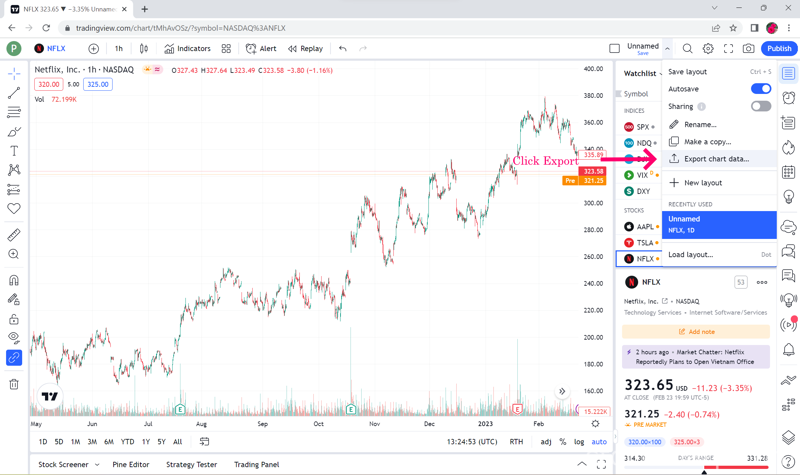
👉Select
Export Chart Data.

👉In the
Time format box, select
ISO time.
👉Click
Export.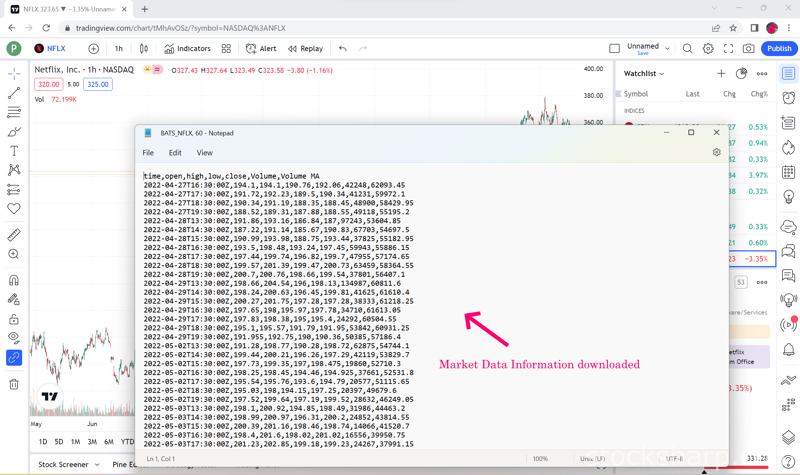
👉Open the
downloaded Market data file. You can see that the top bar is
date and time, open price, low price, close price, volume and volume MA.👉S#.Data supports only the first 6 data, the last one
volume MA we will not take.
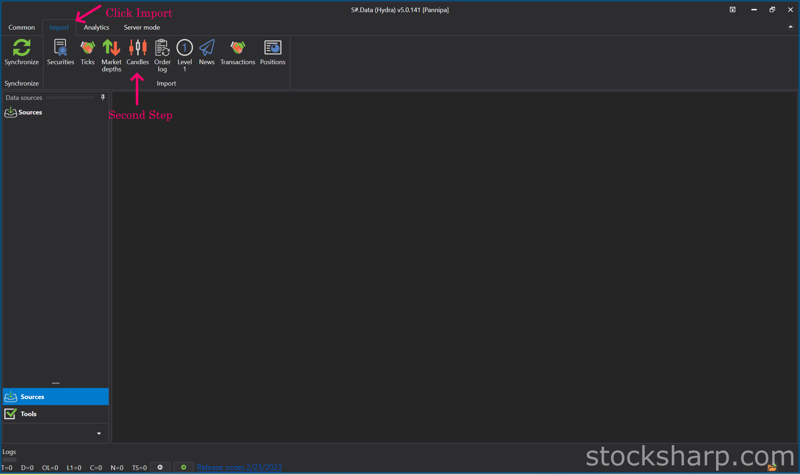
👉Open up your
Гидра Application.
👉Visit our instruction if you doesn't have
Гидра application.
👉
How I can get S#.Data👉Go to
Гидра application, click select
import and Click
candle.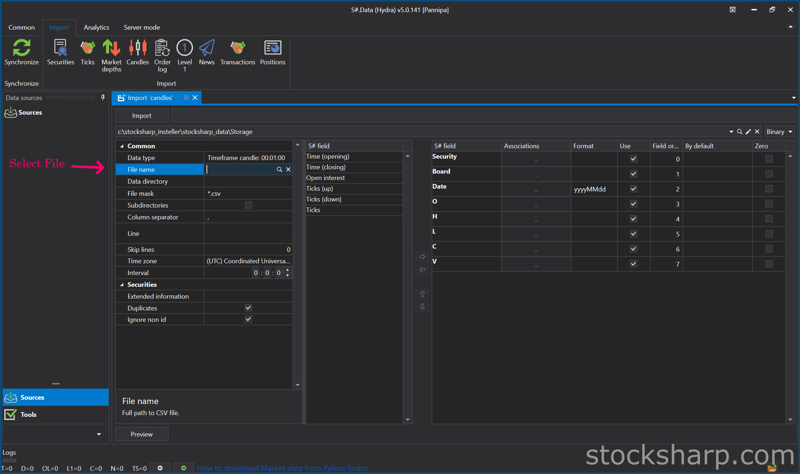
👉Find the name of the file we just downloaded (btw, you can import by directories as well).
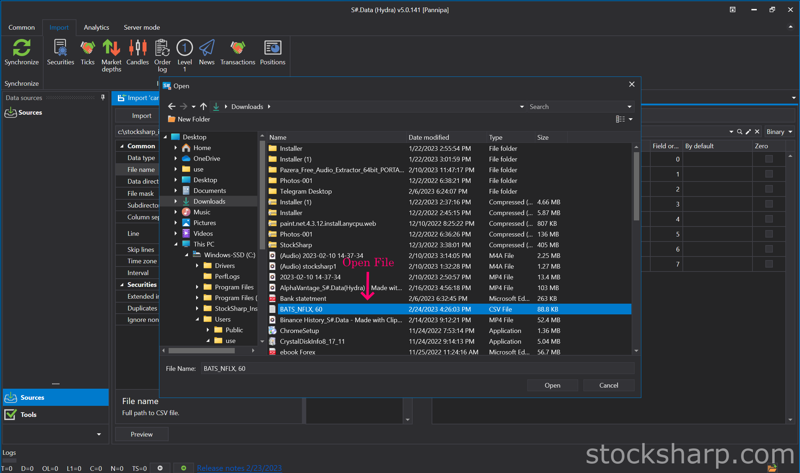
👉Click to select the
file that we downloaded, click
open.
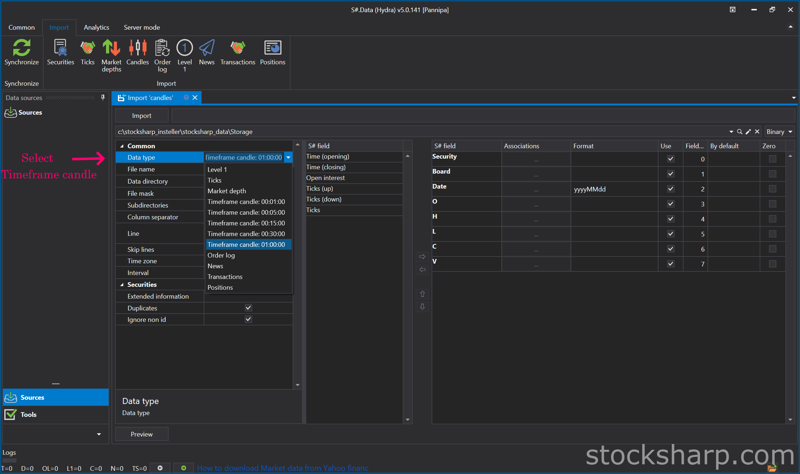
👉Click to
select the time frame to match the timeframe we selected in the file we downloaded initially in the data type field.
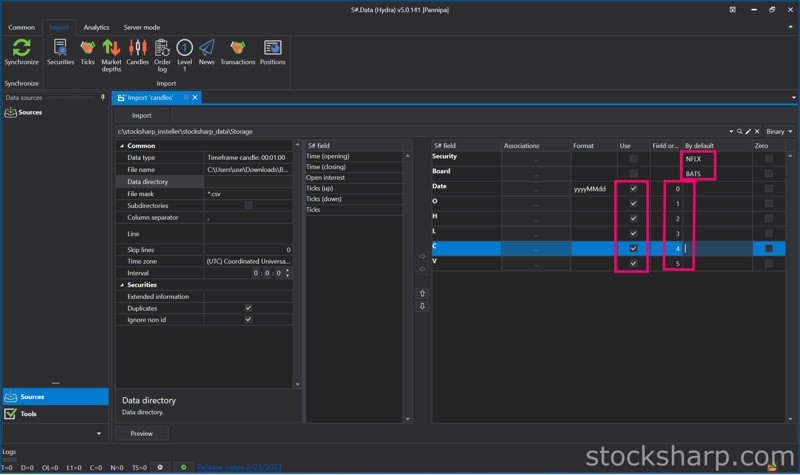
👉Setting
S#.filed from the
Security and Board fields.
👉By default put the
Instruments Code that we downloaded. For example
NFLX in the Security slot in the
instrument board e.g.
BATS by default.
👉Enter numbers
0-5 in the date box and so on.
Remember - numeration started from 0, not from 1.
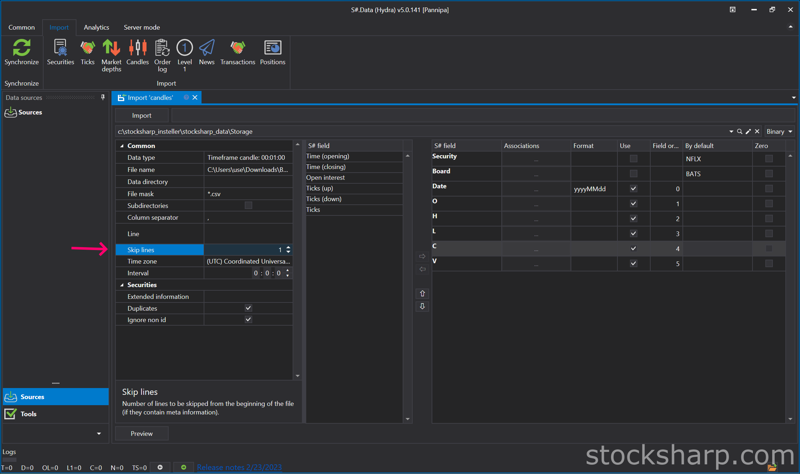
👉Skip
lines Row 1 cause it contains data columns description.


👉Open the file that we downloaded again, select
Copy, time, date that we started downloading Market Data.
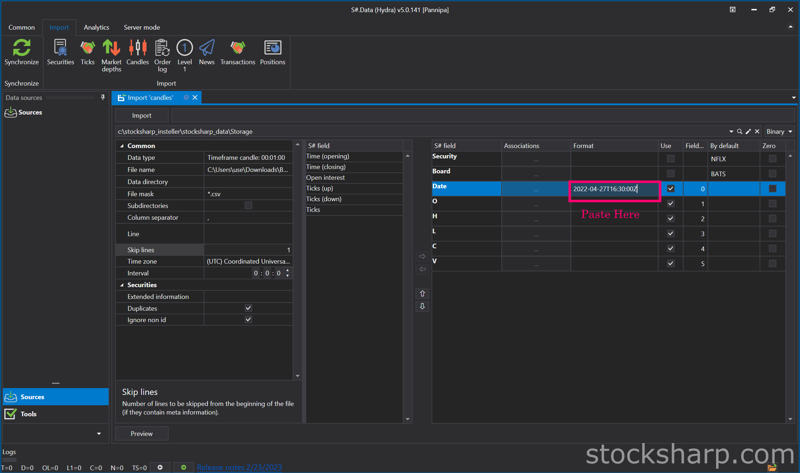
👉Press
Paste in the Date Format field.
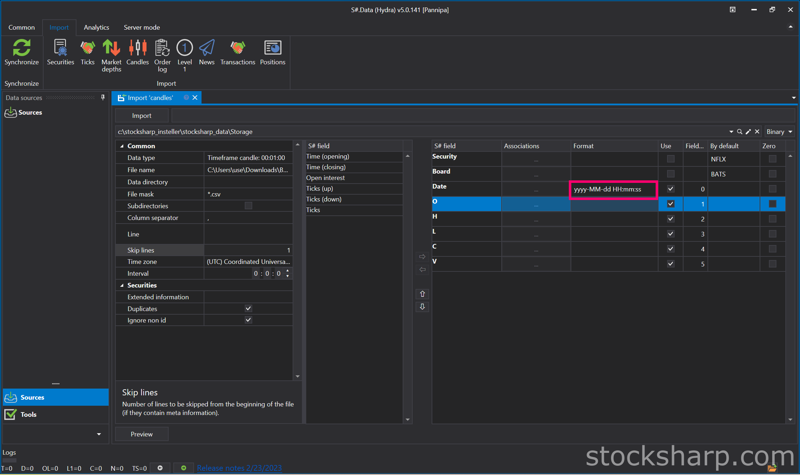
👉Change Numbers to Code Letters By
yyyy-MM-dd HH:mm:ss You can read more about format on
Microsoft website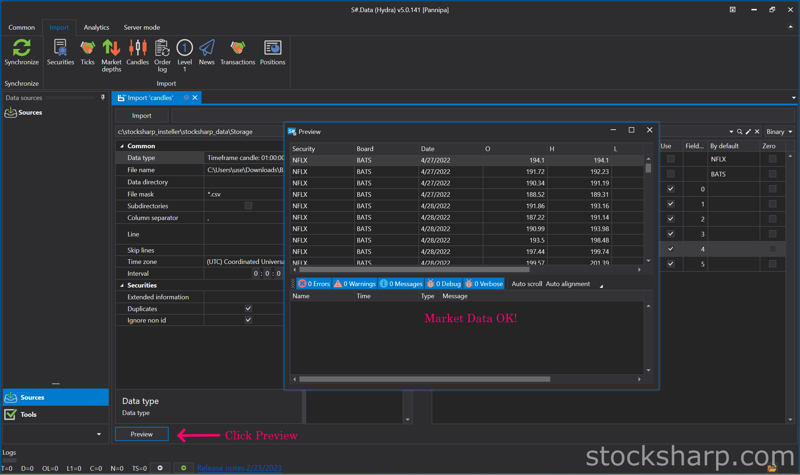
👉Once everything is entered
correctly, click
Preview to double check before importing.
👉When the screen shows this page, there is no problem.

👉But if you press Preview and the screen appears like this, check the details that you have entered again to see if there is any mistake, correct it and press
Preview again.
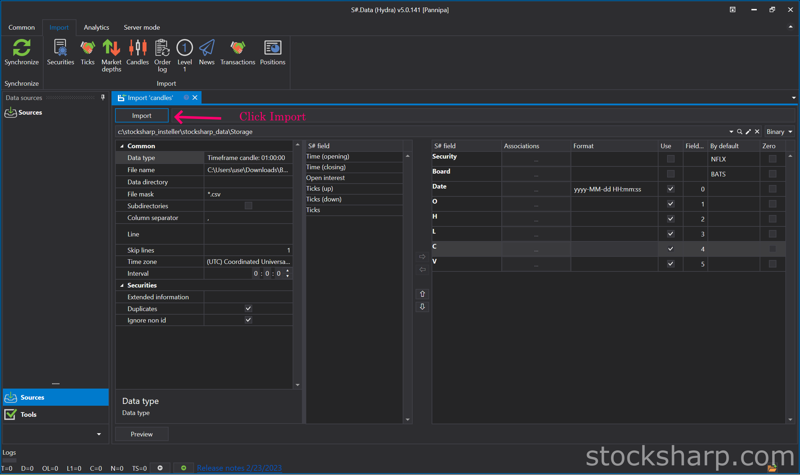
👉Once it's verified and there are no problems, press
Import.
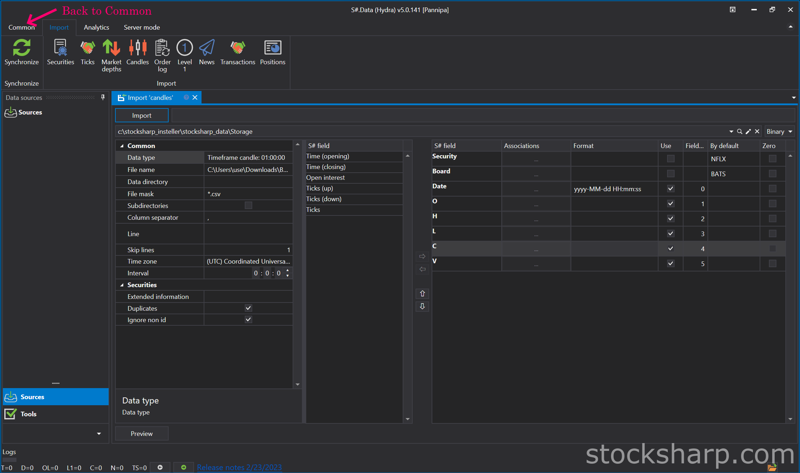
👉When done, click Back to go to
Common.
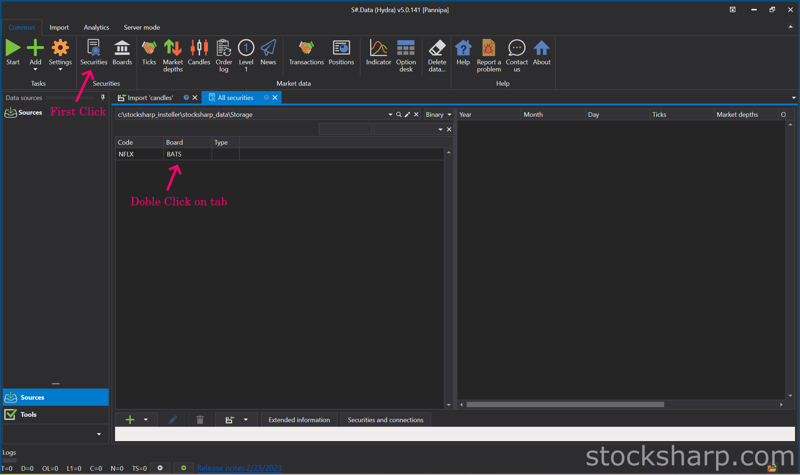
👉Click on
our Security.👉Click on
Instrument Tab to view market Data.
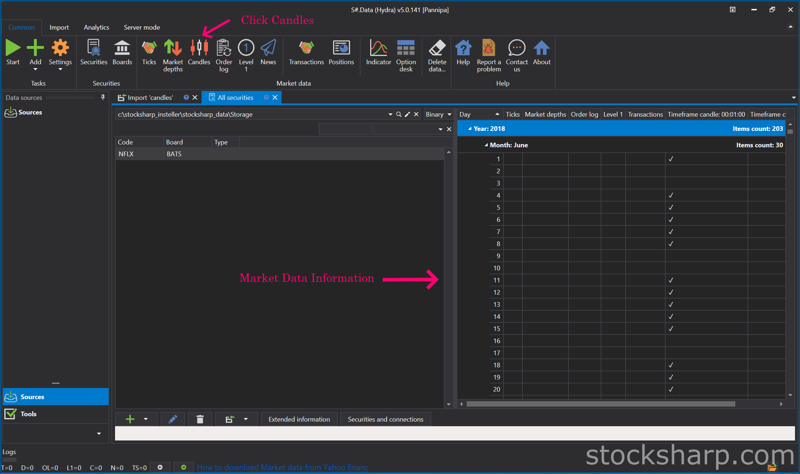
👉Now let's see what data was imported. Click
Candles.
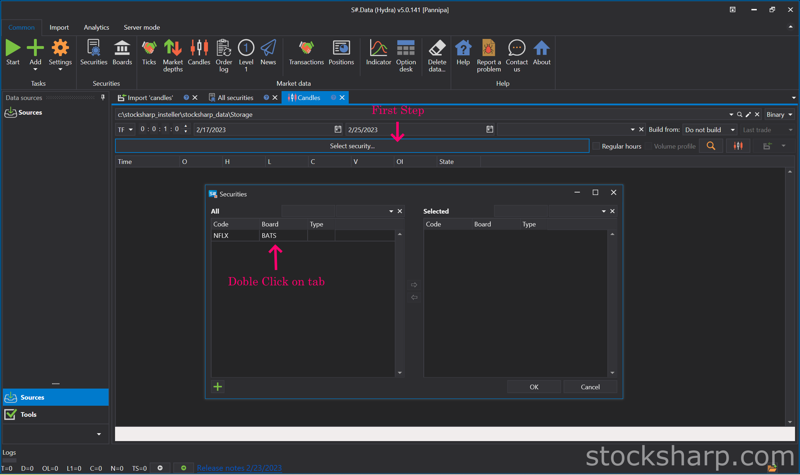
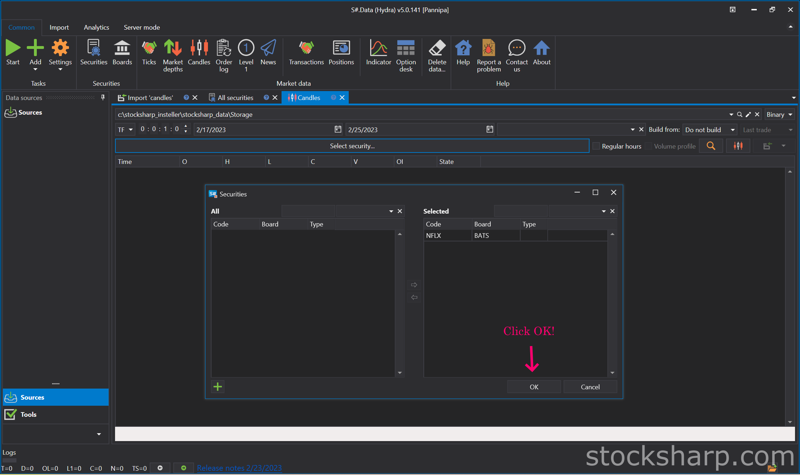
👉Select
Security, select the Instrument to view by double-clicking the
Instrument Tab, move it to the right side and click
OK.
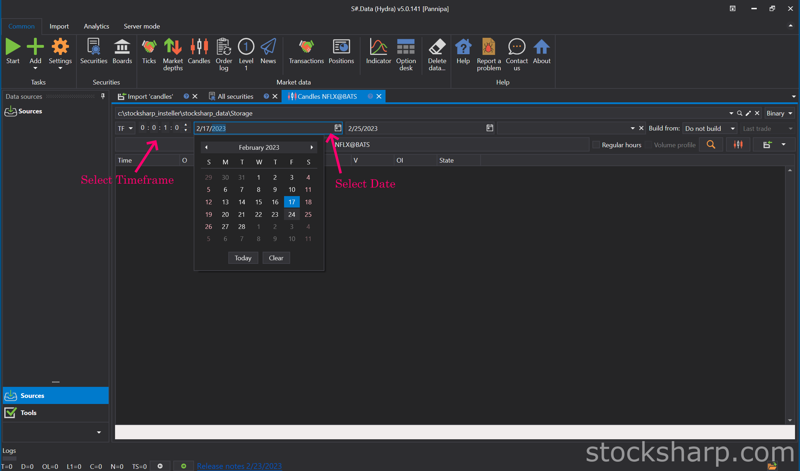
👉Select
date and time frame.
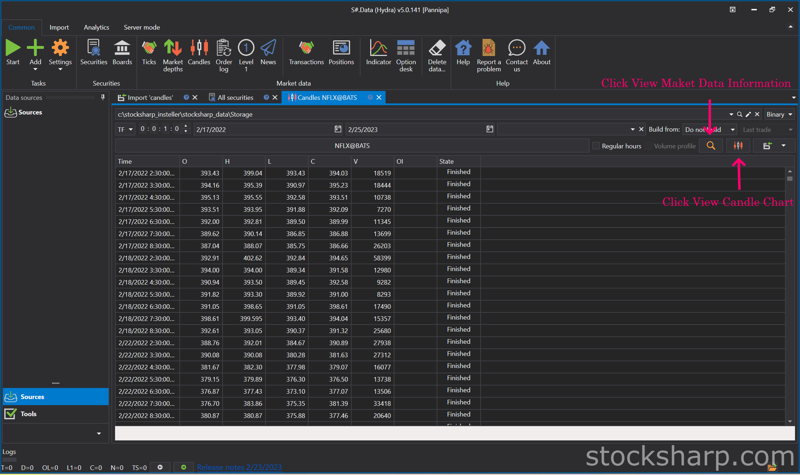
👉Click
View Market data.👉Click
View Candle Chart to see our candles as a chart.
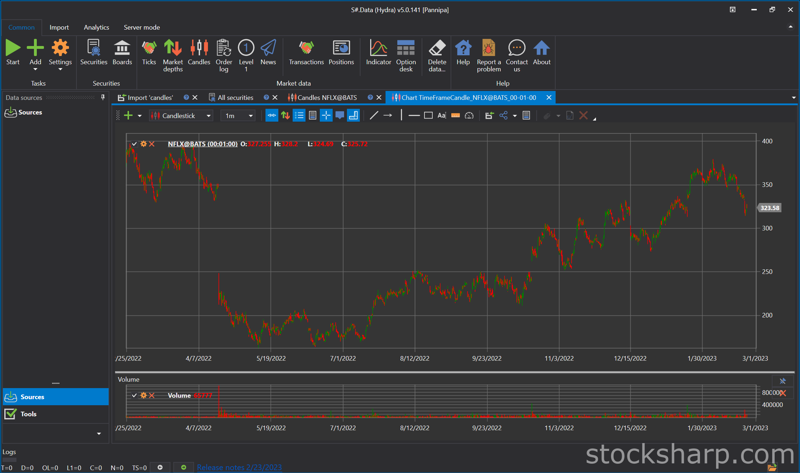

👉This is a Candle Chart comparison between the Chart that was in TradingView website before it was downloaded and the downloaded Chart rendered in S#.Data application.
💥💥Now you know how to import from a CSV file. To make this process you no need to use only limited websites like TradingView. S#.Data supports any format of CSV files that you can download from a variety of sources and websites.
💥Hope this blog is interesting for you. Please comment us what you interesting to know more about S#.Data. We will try to write our next posts.