How to read Momentum and Rate of Change indicators to find buy and sell signals in uptrends and downtrends?
💥The Momentum and Rate of Change indicators are both momentum indicators that help traders identify the strength of a trend and potential trend reversals. They can be used to find buy and sell signals in uptrends and downtrends.
💥💥In an uptrend, the Momentum indicator should be above its centerline and rising, indicating upward momentum. A crossover of the Momentum indicator's centerline from below to above can be a buy signal. Traders may also look for bullish divergences between the price and the Momentum indicator, where the price is making lower lows but the Momentum indicator is making higher lows. This can signal a potential reversal and a buy signal.
💥Similarly, in a downtrend, the Momentum indicator should be below its centerline and falling, indicating downward momentum. A crossover of the Momentum indicator's centerline from above to below can be a sell signal. Traders may also look for bearish divergences between the price and the Momentum indicator, where the price is making higher highs but the Momentum indicator is making lower highs. This can signal a potential reversal and a sell signal.

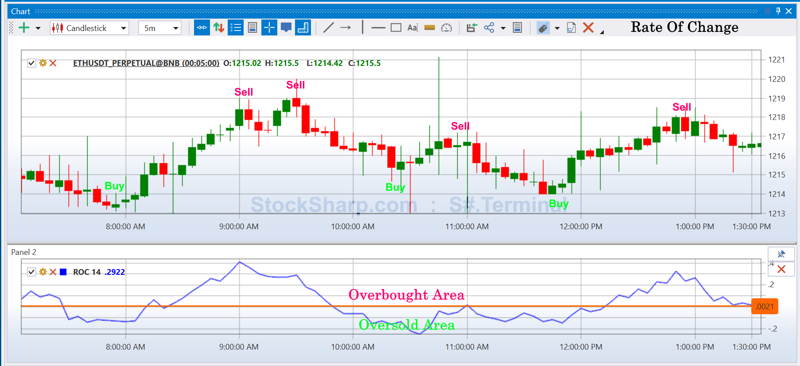
💥The Rate of Change indicator is similar to the Momentum indicator and can also be used to find buy and sell signals. In an uptrend, the Rate of Change indicator should be above its centerline and rising, indicating upward momentum. A crossover of the Rate of Change indicator's centerline from below to above can be a buy signal. Traders may also look for bullish divergences between the price and the Rate of Change indicator, where the price is making lower lows but the Rate of Change indicator is making higher lows. This can signal a potential reversal and a buy signal.
💥💥In a downtrend, the Rate of Change indicator should be below its centerline and falling, indicating downward momentum. A crossover of the Rate of Change indicator's centerline from above to below can be a sell signal. Traders may also look for bearish divergences between the price and the Rate of Change indicator, where the price is making higher highs but the Rate of Change indicator is making lower highs. This can signal a potential reversal and a sell signal.
💥As with any technical indicator, it's important to use these indicators in conjunction with other technical analysis tools and to consider the overall market conditions and the underlying fundamentals of the security being traded.