Slope and Retracement in technical analysis.
💥
Learning to observe Slopes and Retracement A novice trader should have some basic knowledge in this regard as well. In order to use it as a tool to find a time to buy or sell. Be it the Forex, bitcoin, crypto market or the stock exchange in general, the same principles apply to technical analysis.💥 Okay, even though we know the trend and the change in trend, and have identified preliminary trading signals, being overly confident might not always be beneficial. Reversals are crucial and highly valuable in technical analysis. This is because they refer to the slope correction, or what is called the "slope zz" of the trendline in Western terminology.
From Figure 1, it can be seen that the trend has many lines and the trend is adjusted to different angles. It is not that the trend has only one line and cannot be dragged by others. The rules for drawing the line There may be a variety of methods but the most popular should understand the rules of adaptation also known as retracement.
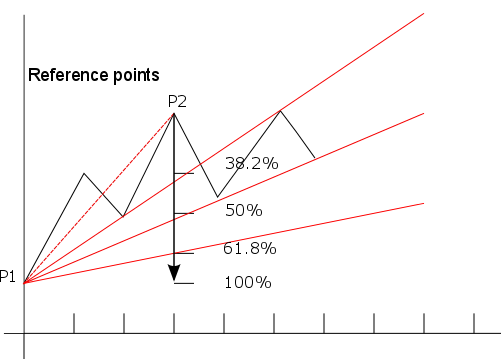
💥 In Figure 3, it can be seen that when the price reaches a certain level, for example, 100 euros, there is a decrease. At this level, the price should have the opportunity to rebound to the original trend at approximately 38%, 50%, or 61%. If the price drops after going up 100€, it should bounce back after going down 38€ (38%). If it keeps going down, the next support will be at 50€ (50%), and it should rebound. However, some technical analysts do not give as much importance to the 50% level as the 38% and 61% levels. It should not be more than 61€ (61%) because the chances of the trend changing from an uptrend to a downtrend are already very high. Therefore, one should prepare for the trend reversal.
💥This rule is applied to create a speed line (Figure 3), which is a trend line with its own set of rules. The height is divided into three parts from the point where the price is currently moving (1) to the base level where the starting point rests. This creates two trend lines: one showing the 38% level and the other showing the 61% level. This is just one example of optimizing the trend line.
💥The trend lines drawn have different slopes depending on the situation. However, every time the share price weakens and goes down to the support line from the trend line, it has rebounded at least once, also known as a rebound. Some people may use this as a moment to exit the market by selling their stocks. This is suitable if the trend is a downtrend. But if the trend is an uptrend or is about to change from a downtrend to an uptrend, anyone who exits the market may regret it because once they sell, the share price often surges higher than the selling price. Therefore, selling should be considered at the right time.