Candlesticks in stock trading are a constant and necessary attribute.
Today there are no traders who do not turn to candlestick charts and do not track market changes based on it.
The history of the "candle" display of market behavior is rooted in the past, in Japan of the 18th century, when a sequence of "candles" began to visually depict the price maximum and minimum for a certain period, as well as prices at the beginning and end of this period.
It makes no sense to describe the composition of the candle, since any trader knows these basics.
Speaking
in the context of analysis, candlesticks are the basis of all fundamentals,
an experienced trader can only
look at the chart to determine the changing situation.
Sometimes
a trader does not just determine the situation on the market, but is also able to predict changes , since the market tends, under similar conditions, to react equally to "stimuli".
As I wrote earlier,
the abundance of trading tools only provide an opportunity to make deals, turning trading into an exclusively intuitive and speculative action.Serious, not mass trading, requires a systematic approach, that is, you can't just take a terminal and start trading, initially
you need to have knowledge .
This knowledge is based not only on the practical part - trading, but also includes a deep analysis of the market, its behavior on certain events.
Such reflections are clearly demonstrated by candles.
For most users, candles are the maximum and minimum for the period, but the variety of candles can surprise.
Each type of candle has its own meaning for the trader, and is able to provide him with a full amount of information on the desired asset or group of assets.So, various candlesticks may be needed for analysis, but it is quite problematic to get market data for them.
Most programs and resources for downloading market data do not provide such
information , and those that can provide
do not allow you to get data on several types of candles at once .
The second
problem is the need to convert data into the desired format for graphical representation of candlesticks and "visual" analysis.
Do not forget about the cost of such programs, which are rarely even "shareware".
As mentioned earlier,
S#.Data solves these problems.
It
allows not just
to build candlesticks of various types, but also
to save them, which is not a little important
for further use.
Almost all sources do not directly broadcast market data on such candles, respectively, the problem for most programs becomes unsolvable, but
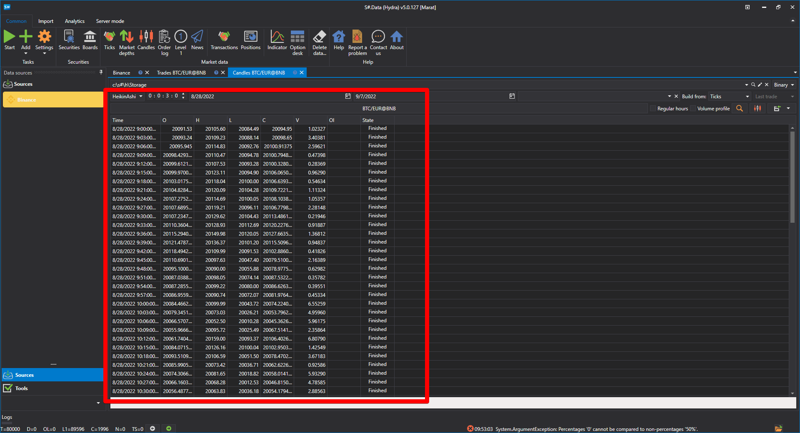
S#.Data solves it by constructing such unique candles through other downloaded market data.
For example from Ticks.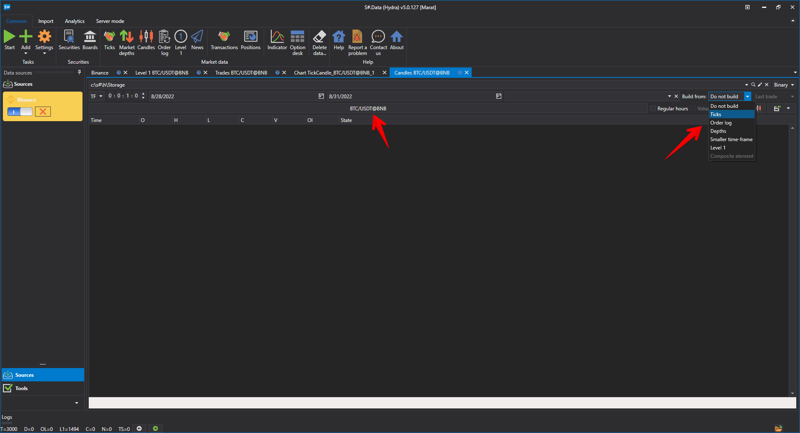
- For example,
Volume Candlesticks, which
display the volume of transactions for the selected period, and provide information about the activity of the instrument.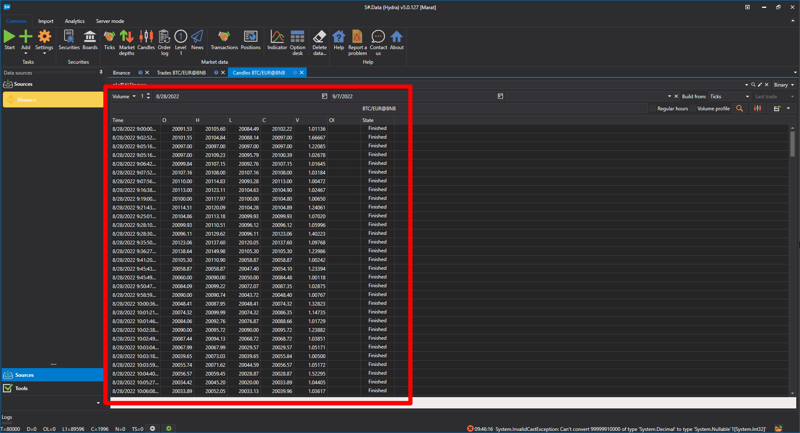
And it is just as easy to plot their schedule
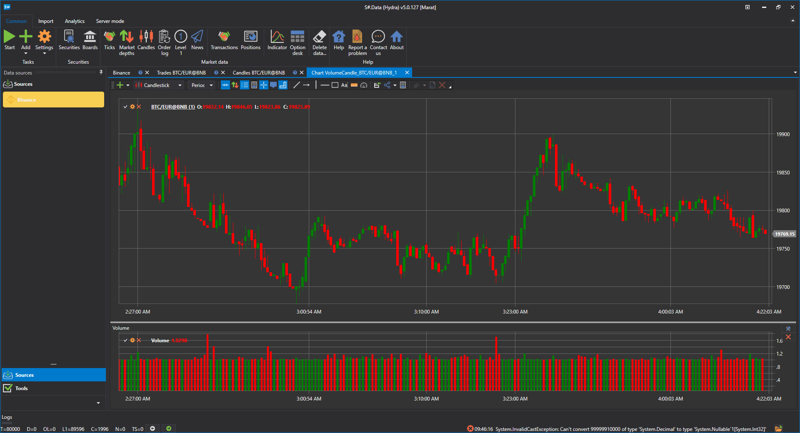
- The program allows you to get
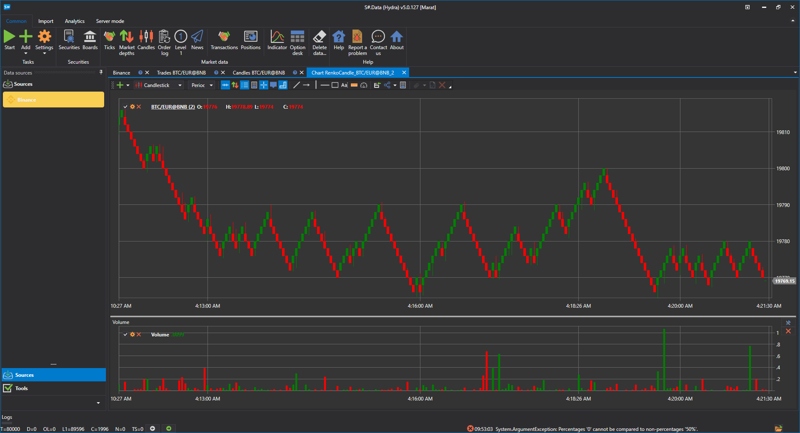
Renko candles.
The ranko chart clearly defines the main trend. Such a chart is useful in order to determine the key support and resistance levels, since it averages the main trend, small price fluctuations are not reflected, this allows you to focus on really significant movements.
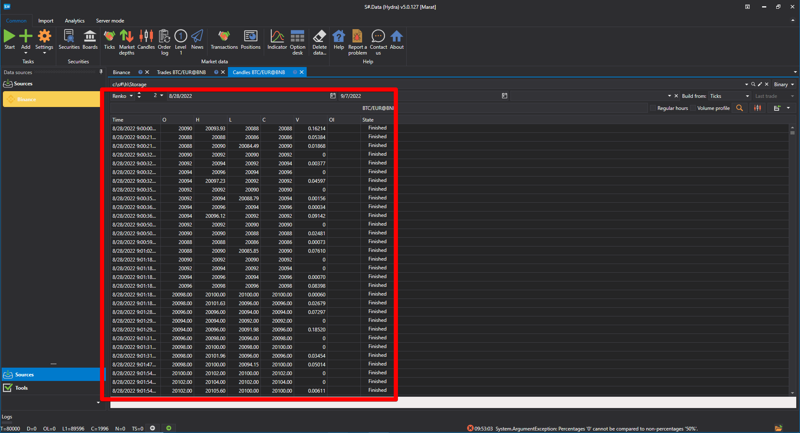
Also, after receiving the market data, we build a graph.
- Equally important candles -
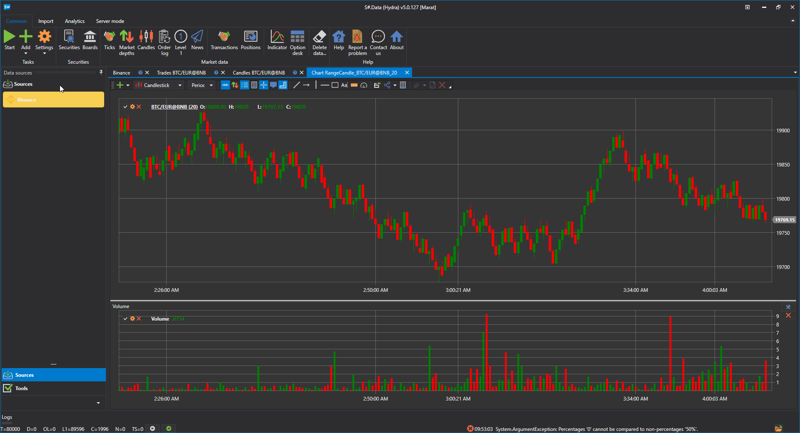
Range candles.
The peculiarity of this chart is that new candles are built depending not on the timeframe, but on the range that the price has passed . Accordingly, it is more convenient for the user to track price fluctuations.
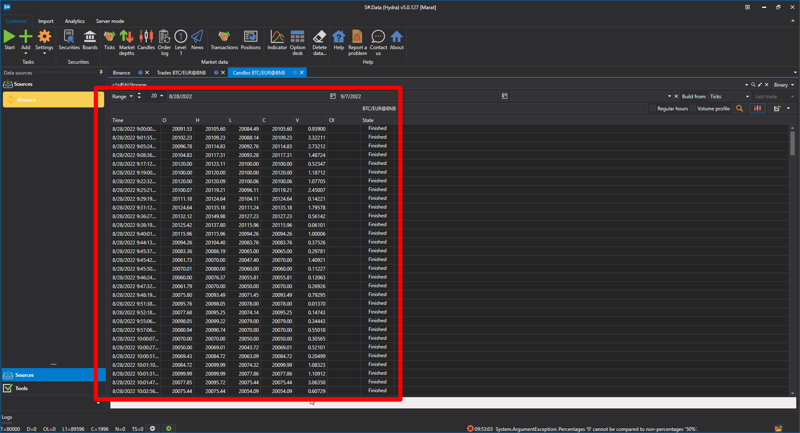
And we also build a schedule.
- In addition to the candlesticks listed above, which are quite familiar to traders and their charts,
Hydra allows you to get unique, but necessary data in the analysis.
So for example
PnF candles (
tic-tac-toe)
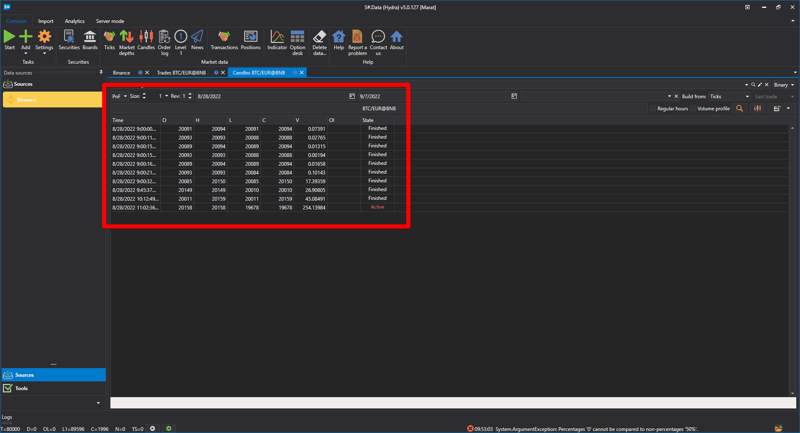
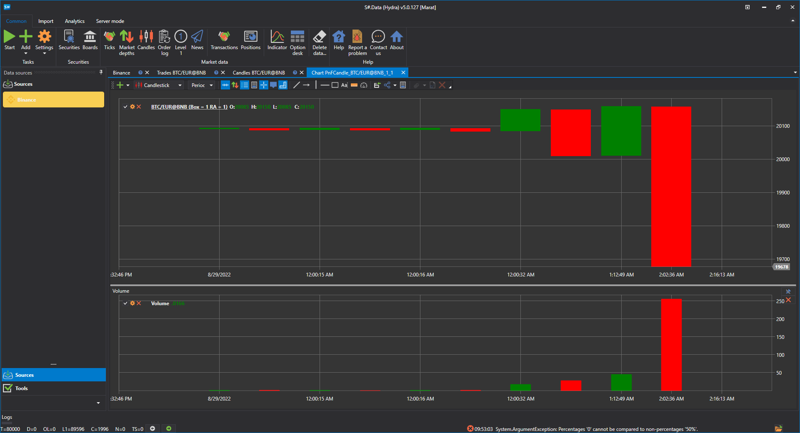
Or candlesticks
Heiken Ashi Candles, used to track the market trend.
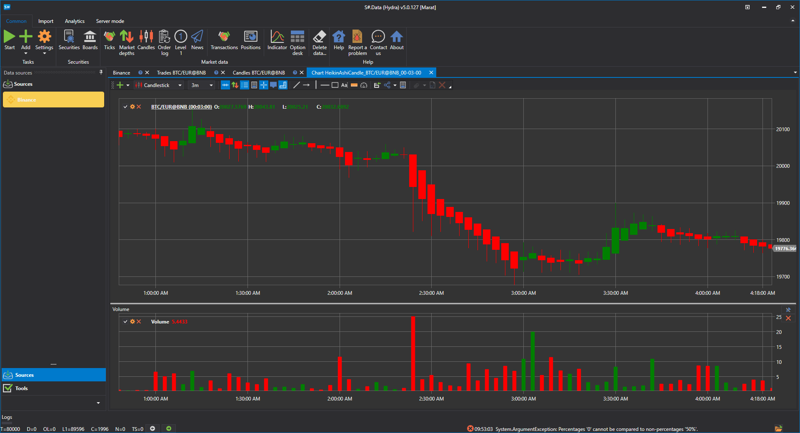
So
S#.Data allows you not only to get ready-made market data, but also to build such data, the receipt of which is not possible. Moreover, it allows you to immediately build charts, combining all the stages for market analysis, reducing the financial and time costs of the trader.
That's it. See you in new articles.