Previously, we have already discussed various trading methods that can be used when trading, in order to increase its profitability.
For most traders,
following the trend is a sign of the correct approach to trading at the moment. Like saying:
"Following the trend is already 50% successful trading". There is hardly a player in the market who will deny this statement, especially if the trend is turned in the right direction for the trader, he gets a guaranteed profit.
The trader's desire to extract the
maximum profit is aimed at finding a point of entry into the market when the price is either minimal for buying the desired asset, or maximum for selling the existing one.To determine such points, a trader often needs not only a flair, which is generally one of the most important qualities, but also the ability to use complexes from a combination of trend and counter-trend strategies.
In the market, there is always a kind of confrontation between trend traders and counter-trend traders, using pullbacks and local changes in market trends.
The k
ey to success and, as a result, getting the maximum income, is to merge these two strategies in a combination of experience and trader's flair.However, it is worth noting that even a less experienced market player can trade using a combination of these strategies, just using automated trading systems and trading robots. For example, such as
"Mr. Hyde" from
StockSharp, which allows even a less experienced trader to use the movement against the trend, in order to increase revenue.
What is the combined method of trading?The basic rules are the basis for this method:1. Finding a way to determine a long-term trend or trend on the chart.
2. Determining the opposite counter-method that allows you to determine the pullback signal, as well as a short – term trend change in the opposite direction-determining the counter-trend.There are various methods for determining points of entry and identifying subjectively correct methods of determination. Often, these methods seem quite complex to novice traders, but when you look at them in detail, they are quite accessible.
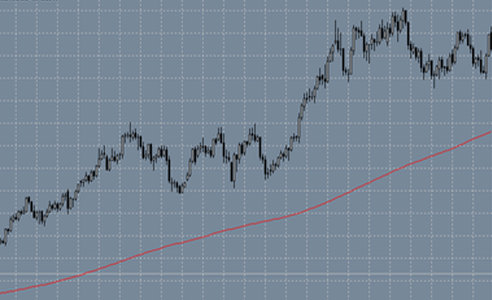
Let's look at one of the ways.First, we need to identify long-term trends in the market. To do this, we will build a price chart and a moving average chart with a period equal to 200. You can build such a graph using the
S#.Designer program, using the tools provided in it.
 This method is very common among analysts, and allows you to determine long-term trends in the market.
His idea is that if the price is located above the indicator line, the market is growing, and if it is lower, the price is decreasing.
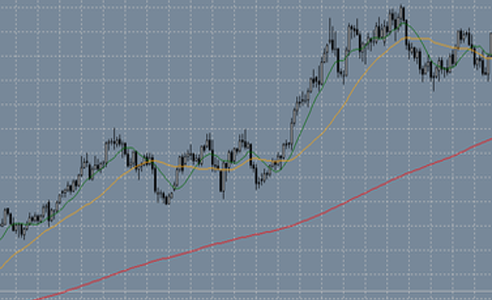
This indicator line is a General indicator of the market trend. Now, to determine the entry points to the market, we add two more averages, using periods of 10 and 30 days.
 What is the point?
In cases when the ten - day moving average will be above the thirty-day one and above the main two-hundred-day one, we can talk about a stable
UP-trend.
UP-TREND is one of three types of trend, which is a sequence of rising lows or highs of prices. it is a series of consistently rising lows and highs of prices. I
n other words, UP-TREND shows price growth over a period of time. It is also called a bullish trend in the FOREX market.If the situation with the moving average is the opposite, and the ten-day moving average is below the remaining two, then we can talk about a downtrend, or as it is commonly called a
bearish trend.A change in the direction of the trend can occur over a long period, and there may be an error in the form of a delay. In order to avoid this, you can use a counter-trend indicator.
Each user chooses such an indicator for himself, focusing on the convenience and technical capabilities. For example, to get market data, although the latter problem is solved using the same S#.Designer or
Hydra, which downloads market data online.
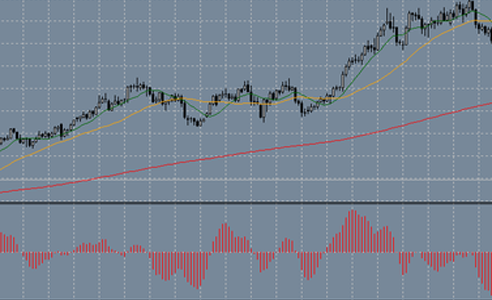
For example, we will use an oscillator that will cross the zero line. For example, consider the graph below.

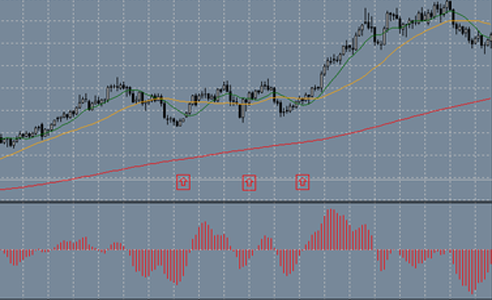
So, let's determine the points where the long-term trend is changing and where you can make an entry to the market. By placing the charts together, or combining them, we can determine the points at which we could enter the market. These points are shown in the graph below.
 As you can see, this method is quite simple to work with. However it has its drawbacks:- You need to understand that the method shows repeated signals, and it may turn out that the point that the trader has identified for entry may be a trend reversal.
- It is important to understand that any method can not be considered a fully automatic method and requires the intervention of the trader, and trading robots simplify the work of the trader, but also depend on its settings.The General conclusion is simple: trading using a combined trend and counter-trend method allows the trader to increase their income by using the direction of market movement.
A trader should rely not only on trading systems and trading robots, but also on their intuition and knowledge, which together make it possible to increase profits.