Today we are looking at a
very important element of exchange trading, without which the trade itself would not make sense, since without information about the positions of trading instruments, trading would turn into chaos.
So quotes of exchange elements are data that allows market players to know in real time any changes that occur with trading instruments. Changes in price, volume, and other information contained in the exchange quotation.The exchange quotation plays a major role in the analysis and testing of trading strategies. Getting market data of stock quotes is the key to correct testing of the trading robot. Sometimes getting market data is burdened with conventions: paid content of resources, limited data period. However, the
Hydra program allows you to download market data from a huge number of sources for free, as well as the
Designer program, which is clearly shown in our tutorial video.
In addition to the information that market data carries, the important value is the selected data timeframe.
What is a timeframe?
Timeframe — the time interval used for plotting stock price charts.Its main task is to allow you to visualize graphically the trend of changes in the parameter of the exchange quotation. For example, you can see how the price changed over equal periods of time.

Let's consider the main element of the timeframe –
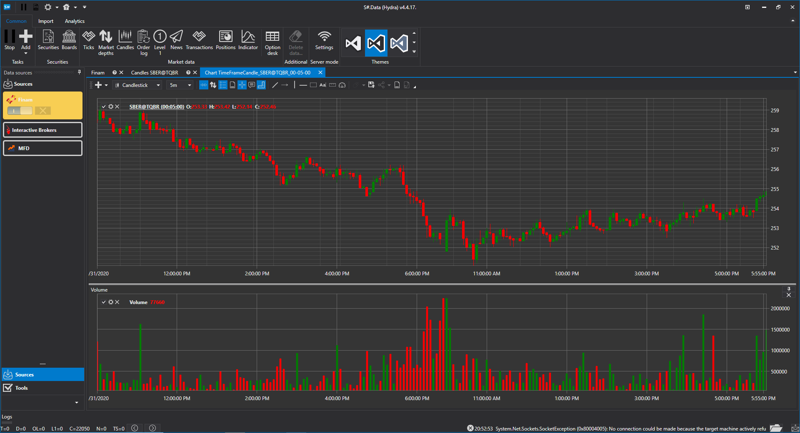
candles. Candles are formed within the time period set by the trader, so we can see how the price changed during the week or during the day.
A candlestick chart can give information about the maximum and minimum for the period set by the timeframe, and show changes in the volume of quotes. they can tell us about the maximum and minimum prices for the corresponding period, and we can use them to see the opening and closing prices.

At the same time, to get a more detailed movement of parameters within the timeframe interval itself, you need to use tick data, from which the chart is also built. The tick chart is the most accurate, since it gives a detailed change in data, not the final one for the period.
Let's look at how timeframes are designated:M-means a minute (for example, M4 is a five-minute time frame).
H-indicates the hour (for example, H1 is an hour timeframe).
D-means day, sometimes the value "Daily" is used (for example, D10 is a ten-day timeframe
W-means week, and the term Weekly is also used (for example, W2 is a two-week timeframe)
MN-means monthly, it can also mean Monthly (for example, MN3 – a three-month timeframe).
Y-indicates a year (for example, Y5 is a five-year timeframe).Older timeframes consist of younger ones, so for example, you can create a ten-minute timeframe from two five-minute ones.
Different timeframes can be used for different purposes:Minute and hour time frames:
Often used for trading method of scalping, derating, scalping.
Short timelines are used for faster trading, often limited to one trading day.
From hourly to daily timeframes
They are often used for medium-term trading. The most moderate trading speed, it is often chosen by novice traders.
From daily to annual timeframes.
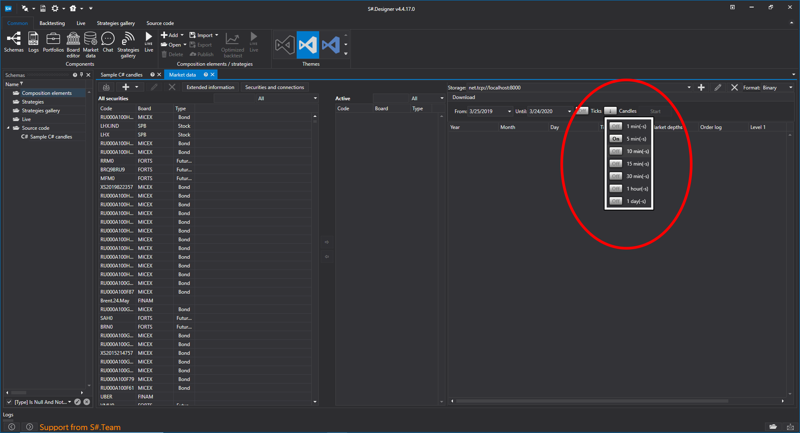
For the most part, these timeframes are used by investors who place their capital for a longer period, with the prospect of generating income in the long term.So, we have considered the main types of time frames. Of course, successful trading consists of using different timeframes. The combination of them gives the most optimal solution for increasing the trader's income. This is why all our products from Designer to
Shell can work with different timeframes, and Hydra allows you to choose several timelines for downloading at once.